Greater Seattle Housing Market Update – Summer 2019

“Summer, summer, summertime. Time to kick back and unwind.”
_–_DJ Jazzy Jeff & The Fresh Prince
Summer, we’re glad you’re here.
June offers up two reasons to celebrate: Pride and National Homeownership Month. We are staunch advocates of improving equitable access to homeownership. Polls consistently show that most people in America want to own a home at some point.
A sharp decline in housing affordability is hindering millions of aspiring homeowners from reaching their goal. The cost of land, labor market dynamics, government regulation, population flows, high home prices, and soaring rents are just a few of the culprits. Rents in Seattle are growing at 3.1%. While new development has kept rents from taking off, Seattle still ranks amongst the top 10 most expensive U.S. cities for renters.
Better education and support for home-buying is needed. A recent survey of U.S. adults by Fannie Mae makes this clear:
- Most people overestimate the financial inputs required to qualify for a mortgage.
- Thirty percent believe a 20% down payment is required (the national average is 7%).
- Only 23% are aware programs exist for low down payments.
- One in four believe ‘perfect credit’ is necessary to buy a home.
The Fannie Mae study concluded ‘current sources of mortgage education and information are insufficient’ and ‘may be holding people back.’
This is to be expected: buying a home is tough. There are many things to consider. While financing can be a beast of a process, searching involves making determinations on budget, location, property type, style, state of repair, size, amenities, and so on. Most buyers end up compromising on one or more axes. Next comes making offers, negotiating, and the closing process. Nearly half of buyers are purchasing a home for the first time, and the average U.S. homeowner stays put for a decade. Not quite like riding a bike, then.
Teaming up with friends, family, or a loved one can make buying and owning a home more affordable and more enjoyable. It also introduces added dimensions: aligning preferences, combining financial inputs, structuring co-ownership, defining rights and responsibilities, and thinking about “what if” scenarios. That’s why we founded CoBuy: to make it easier to buy and own a home together, intelligently. Every month, we bring you objective analysis to help make sense of what’s going on in the local housing market. Better information = better decision-making.
Happy summer!
-Team CoBuy
Buying a home together in the Bay?
Learn how CoBuy makes it easier, more efficient, and better protected.
At a glance
Interpreting market conditions can be challenging. Are housing markets around the Puget Sound cooling off or heating up? The devil is in the detail.
King County
Median Sale Price
$641,000
(+12% year to date)
Homes for Sale
6,107 properties
(+24% vs. last month)
Pending Sales
3,676 properties
(+8% vs. last month)
Average Days on Market
25 days
(-4 days vs. last month)
Source: data from NWMLS, includes single-family homes, condos, and town homes.
For all the talk of softening, we are seeing healthy activity in the market:
- Prices are up year to date across King County.
- Inventory, or number of homes listed for sale, has increased. This is to be expected this time of year as May is peak home-buying season.
- Pending Sales are up month on month, and a touch higher than this time last year.
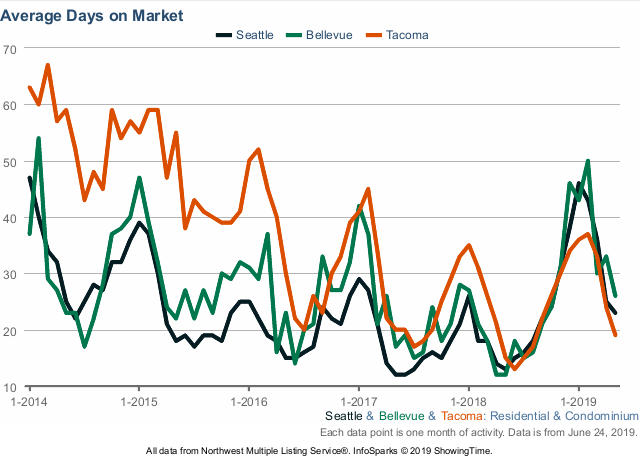
- Average Days on Market is down across King County, but also in Seattle, Tacoma, and Bellevue.
Activity levels, the depth of buyer demand, and competition vary by geography and price point. On average, buyers can expect well-priced properties in desirable locations to sell quickly with the potential for multiple offers. This is particularly true of “entry-level” homes.
Seattle remains a competitive market, with homes selling around list price. According to CoBuy-certified™ real estate agent Kevin Yuen, “we are currently experiencing a more balanced market in Seattle compared to this time last year.” This presents opportunities for savvy buyers. Yuen’s suggestion to buyers? Keep an eye on how many days a home has been on the market as “precision pricing” by sellers is critical. “Buyers who are interested in a property that has been on the market for more than 14 days should consider making an offer 3-5% below the asking price.”
Down South, Tacoma is being touted as the hottest housing market in the nation. Many buyers are deciding that on a relative value basis, Tacoma is simply more affordable. The median sale price is up 10.2% year on year, half of all recent homes sold in under two weeks, and roughly half of all recent homes transacted sold above asking.
The bottom line: markets around the Puget Sound remain competitive. Home prices in Seattle are up 67% over the past five years, according to NWMLS data. To increase competitive positioning, buyers may choose to team up with friends or family members to increase their purchasing power. Whether financial participation comes in the form of a gift, a loan, or co-ownership, adequate preparation is essential. Co-buyers should agree upon and define shared objectives up front. Naturally, support from a team of experienced professionals provides distinct advantage before, during, and after the purchase.
Drivers
We reorganize the main themes we see driving local housing markets over the near term, though our conviction remains unchanged.
- The cost of borrowing
- Supply & demand
- Local and national economies
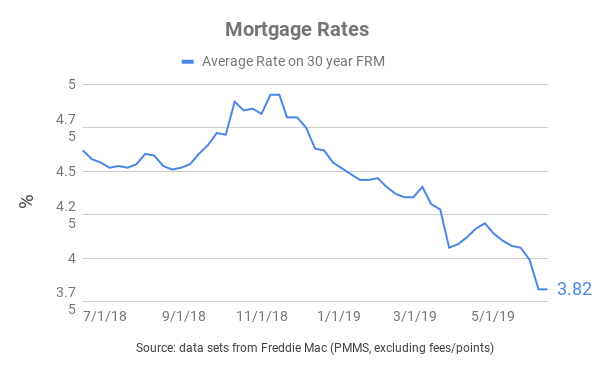
Access to financing is a prerequisite to purchasing a home for most homebuyers. As the cost of borrowing has fallen, so has the cost of buying a home. Many prospective buyers who have been on the fence regarding the timing of their purchase have been incentivized to pull the trigger by lower mortgage rates. At the time of writing, the average rate for a 30-year fixed-rate mortgage hovers at 3.84% (ex-fees/points). The cost of borrowing to finance a home is currently near historic lows. We explore this theme in more detail below.
The supply and demand dynamics in and around Seattle will continue to impact home prices. In Seattle proper, 75 percent of residentially-zoned land is currently restricted to single-family homes. Seattle is a city bordered by natural features on multiple sides: building “out” to increase the supply of housing is not an option. This presents a clear hurdle to density and results in higher home prices. There are calls by some in the city to enact Minneapolis-style regulatory overhaul. After years of grass-roots campaigning and community engagement, Minneapolis made headlines last year when it became the first major U.S. city to scrap single-family zoning. An overhaul of residential zoning is badly needed, but unlikely to materialize overnight.
Robust local and national economies contribute to a growing professional class of residents with significant purchasing power. Among the nation’s largest metros, Seattle ranks second for pay growth and third for job growth over the last year. Job creation, population growth, and higher wages increase the demand for housing.
Price action
Trending up in 2019…
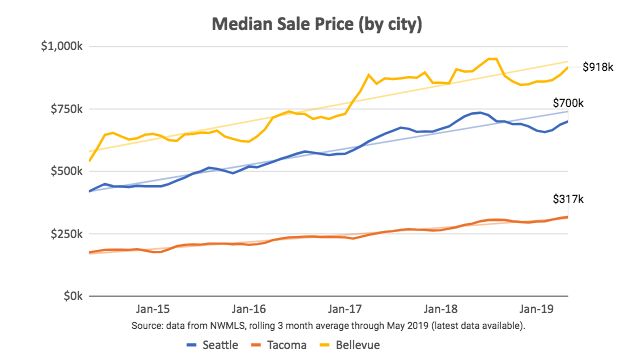
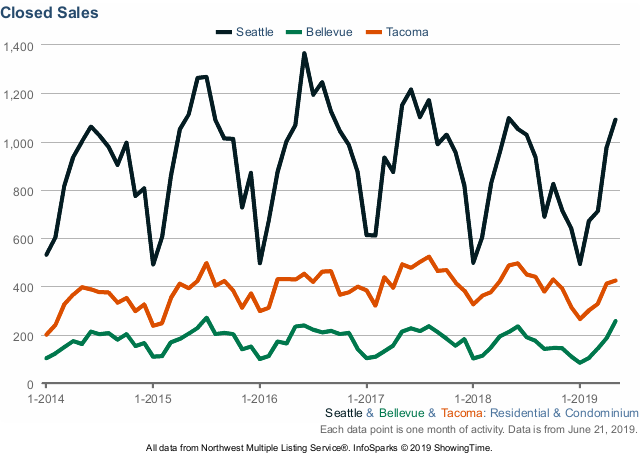
In aggregate, home prices are approaching the peaks reached in 2018. The graph below shows the evolution in the median sale price by city (note the distinctions between list price, sale price, and home values at the end of this section).
Many articles in the press talk about softening in local housing markets. Ironically, few point out that the median sale price in Tacoma is at an all-time high while in Seattle, it has increased over 13% since the start of 2019. This price appreciation has taken place even as the inventory of homes on the market has risen since January. The market is digesting new supply without any problem.
Job growth and rising incomes are likely to contribute to moderate price appreciation over the coming months, barring any shocks.
Jargon Busting
List Price: the price at which a seller advertises a property for sale on the market.
Sale Price: the price at which a seller and a buyer agree to transact. The median sale price for a given data set is the price “in the middle” of all sale prices when arranged in order of value. Referencing the median sale price instead of the mean sale price is useful as it reduces skew from outlying data points.
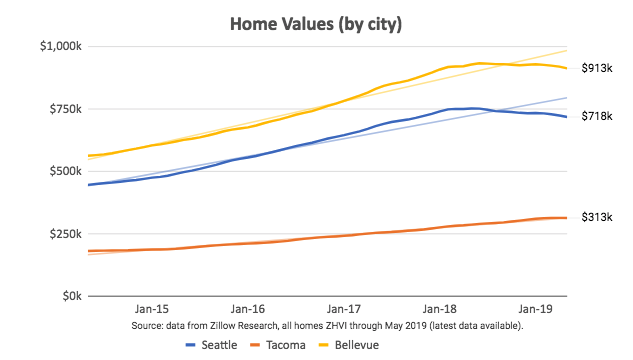
Home Value: a proxy for the value of a property, or how much it is “worth”. Ultimately, the true determination of value can only be established through transacting. Most homes in a particular geography aren’t on the market, so indices are constructed in order to monitor fluctuations in local home values in aggregate.
Supply & Demand
Brisk activity driven by seasonality and rates.
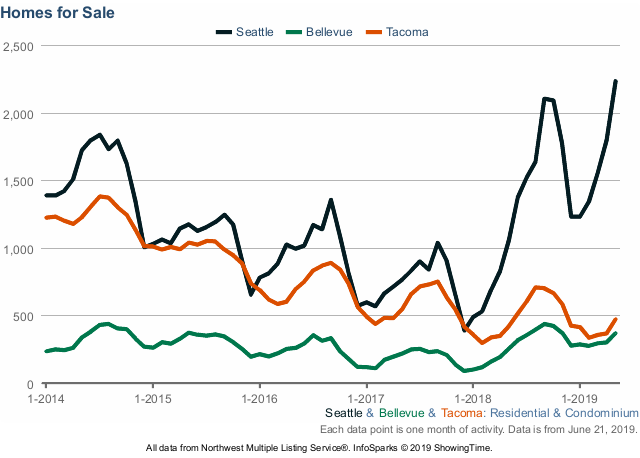
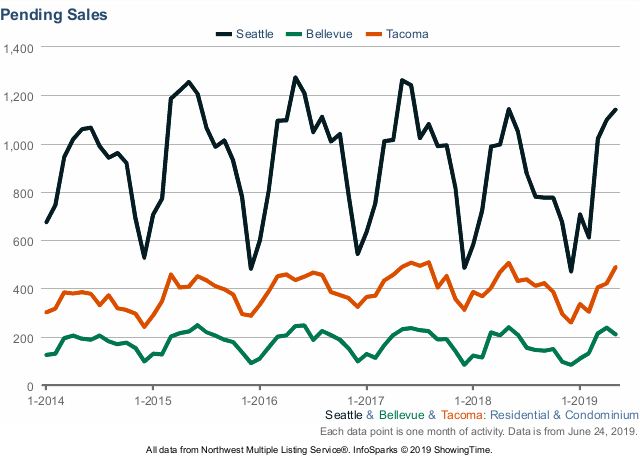
The number of homes for sale, pending sales, and closed sales across Greater Seattle have all increased since the start of the year, consistent with years prior. The average days on market has decreased (in line with what we might expect of the late spring/early summer season). Well-priced properties in cities and neighborhoods with greater competition can easily sell in two weeks or less.
Seasonality is a factor behind the bump in transactions month on month, as is the fall in rates. While activity in the local housing markets traditionally peaks in May, we expect buyer demand to continue over the coming months.
Rates
If you lend it, they will come.
The cost of borrowing to finance a home purchase is substantially lower today than at the start of 2019. The average rate for a 30-year fixed-rate mortgage has fallen by nearly 70 basis points year to date.
To put this into perspective, consider an example.
Example:
A CoBuy group purchases a home in Seattle.
Assume:
- Purchase price = $750,000
- Down payment = 20%
- Mortgage loan-to-value = 80%
- 30y fixed-rate mortgage
Scenario 1: CoBuy group borrows @ 4.600%
Monthly Payment: $3,076
Total Payments: $1,107,360
Scenario 2: CoBuy group borrows @ 3.900% (70 basis points cheaper)
Monthly Payment: $2,830
Total Payments: $1,018,800
Note: Monthly Payment includes loan principal and loan interest. Total Payments is the sum of all monthly repayments over the full 30-year term.
Result of mortgage rate dropping by 70 basis points:
Monthly Payment: $246 savings
Total Payments: $88,560 savings
Swings in the cost of borrowing have significant implications for affordability.
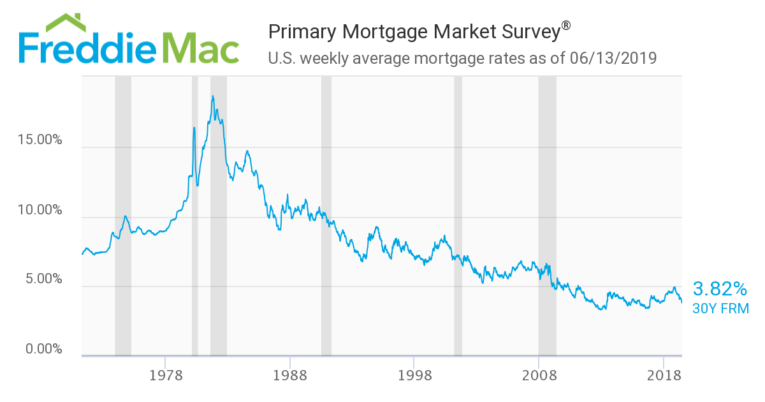
The cost of borrowing is near historic lows.
This has spurred demand from homebuyers, as evidenced by the increase in mortgage applications over recent weeks. The increase in activity from prospective buyers (and homeowners exploring refinancing) is challenging the bandwidth of many mortgage lenders during an already busy buying season.
Pro tip: Buyers benefit from working with a mortgage lender who is responsive, experienced, and excellent at execution. In competitive markets, these are often prerequisites to a successful purchase. CoBuy works with vetted, ethically-aligned lending institutions and loan officers who rank among the best in the business. We do not benefit financially when CoBuyers choose to work with a CoBuy-certified™ Lender, but you may.
Freddie Mac forecasts the average rate on a 30-year fixed-rate mortgage to average 4.1% in 2019 and 4.2% in 2020. Chief Economist Sam Khater predicts favorable mortgage rates will contribute to increased home sales nationally for the remainder of the year.
U.S. Economy
A solid run.
The U.S. economy is experiencing what may turn out to be the longest period of economic expansion in its history. Growth is strong, unemployment is at a 50-year low, inflation is below the 2% target, and consumers are optimistic on the whole.
| GDP | Unemployment | Inflation | Consumer Confidence |
|---|---|---|---|
| 3.1% | 3.6% | 1.8% | 100 |
| Strong growth reported for Q1 2019. | Virtual 'full employment'. | Below the 2% target. | 'Favorable levels' despite geopolitical challenges. |
| Source: U.S. BEA | Source: BLS | Source: BLS | Source: U. of Michigan |
It is clear that despite this impressive stretch of growth at the national level, the U.S. faces growing economic disparity at the individual level. Still, many of those who live and work around the country have benefitted from higher incomes, appreciating assets, and financial returns. This is particularly true in economic powerhouses such as the San Francisco, San Jose, Seattle, and Austin metro areas.
According to the World Bank, U.S. growth will temper to 2.6% in 2019 and hover around 2.7% in 2020. This falls within the generally accepted range of sustainable growth at 2-3%. There is no shortage of risk factors, most immediate of which are the ongoing trade dispute between the U.S. and China, a global slowdown, and domestic labor shortages. Excitable pundits are skilled at pointing out the inevitability of future economic downturns, but not so skilled at getting the timing right. Yet the U.S. economy is relatively well-positioned in the context of current indicators.
A robust national economy fuels demand for housing, particularly in densely populated metro areas that serve as professional services and tech hubs.
Greater Seattle Economy
Greater Seattle has one of the strongest, most dynamic local economies on the planet.
Last month, Washington received the dual honors of being recognized as the strongest state economy nationally and the “best state” by U.S. News & World Report. Seattle’s booming technology sector boasts the second highest wages globally for tech with a median income of $138k, adding more tech jobs than any other city over the past two years. Over 230,000 employees work in STEM-related roles (science, tech, engineering, math), equal to 31% of Seattle’s population.
| GDP | Unemployment | Wages & Salaries | Job Growth |
|---|---|---|---|
| 5.2% | 3.4% | 2.9% | 2.8% |
| Stellar growth. | Low unemployment. | Growing wages & salaries. | Booming job market. |
| Source: U.S. BEA | Source: BLS | Source: BLS | Source: U. of Michigan |
Seattle metro’s GDP growth is second only to the Austin metropolitan area, unemployment is low, and both income and job growth are top 5 in the nation. The most significant risk factor to its overall economic performance is a shortage of human capital: companies are struggling to find people to hire.
Co-buying gets you more bang for your buck
Pooling resources to buy a home can be a great way to get a down payment together and to benefit from economies of scale. We illustrate the benefits of combined purchasing power with up-to-date market data.
In the example below, we assume:
- hypothetical purchase in Seattle
- 10% down payment (not a hard requirement, many borrowers qualify with less)
- closing costs (buy-side) amount to 2.5% of the purchase price
- median sale price for a 1-bed = $400k
- median sale price for a 2-bed = $622k
- median list price for a 3-bed = $746k
Source: NWMLS data for Seattle as of June 2019.
Economies of Scale
| Flying solo | Teaming up to co-buy |
|---|---|
| single buyer / 1 bedroom home | 3 co-buyers / 3 bedroom home |
| A single buyer would need $76k in cash up front for down payment and closing costs. | Three co-buyers would need to each contribute $37k up front for down payment and closing costs. |
Breaking it down…
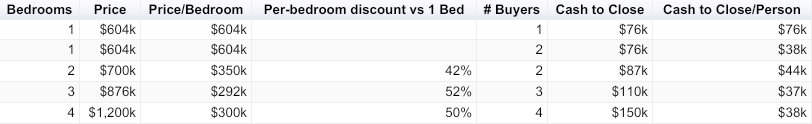
On a per-bedroom basis, purchasing a three-bedroom home in the SF-Oakland-Hayward metro is currently 52% cheaper than purchasing a one-bedroom home. Economies of scale are real! Co-buying can deliver more bang for your buck and provide greater optionality.
Related Posts
Curious about co-buying?
We're here to help, seven days a week.
