Bay Area Housing Market Update - Feb'19

Year of the Pig
The Year of the Pig is officially underway, and with it a “…lucky lunar cycle inclined to bring prosperity and wealth.” In this update, we explore the key drivers set to shape housing markets around the Bay in the months ahead. Here’s to health, wealth, and good vibes in this Year of the Pig.
A glitch in the matrix?
Home prices across the Bay have demonstrated volatility over the last twelve months. Journalists have had a field day. Depending on the media outlet, home prices either rose by double digits or took a tumble in 2018. But we need to compare apples to apples.
Bay Area Median List Prices sky-rocketed in 2018, but finished the year flat
The Median List Price for a home in the San Francisco-Oakland-Hayward Metropolitan Area shot up 18% in the first five months of last year, with similar gains seen in the San Jose-Sunnyville-Santa Clara Metro. From June onwards, however, the Median List Price in both Metros began a steady decline that saw these gains erased on a year-on-year basis. In January 2019, we saw the Median List Price in the SF Metro drop by 2% with no month-on-month change in the SJ Metro.

Bay Area Sales Prices were mixed in 2018
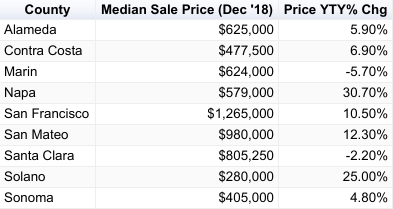
The Median Sale Price of a single-family home across the Bay Area dropped by 3.6% in the twelve months through December 2018, according to California Association of Realtors. But this figure doesn’t tell the whole story. Contra Costa, Marin, Napa, San Francisco, and Solano Counties saw the Median Sale Price for single-family homes increase year on year.
Single Family Homes

Source: data from CAR
Condos fared better. The Median Sale Price for a Condo across the Bay Area rose by 5.2% in 2018. Again, this varied on a county by county basis.
Condos

Source: data from CAR
Overall, Bay Area homes appreciated in 2018
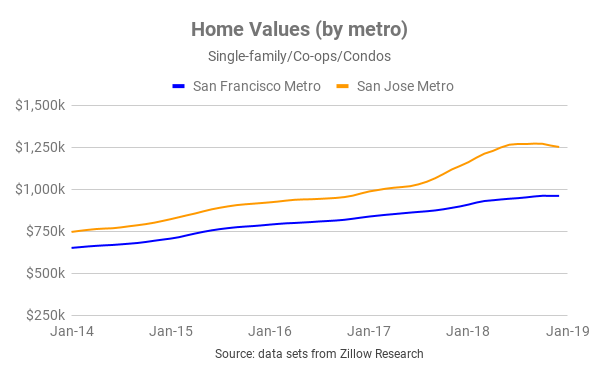
To get a clear view on developments in the housing market, we need to compare apples to apples. Home prices fluctuate over time and according to geography. But in any given month, the homes that are bought and sold may be skewed in terms of type or quality. Median List Price and Median Sales Price data don’t help us here. Instead, we look at indices.
Home Values increased in both the San Francisco Metro (+7.6%) and the San Jose Metro (+7.0%) in 2018.
Jargon Busting
List Price: the price at which a seller advertises a property for sale on the market.
Sale Price: the price at which a seller and a buyer agree to transact. The median sale price for a given data set is the price “in the middle” of all sale prices when arranged in order of value. Referencing the median sale price instead of the mean sale price is useful as it reduces skew from outlying data points.
Home Value: a proxy for the value of a property, or how much it is “worth”. Ultimately, the true determination of value can only be established through transacting. Most homes in a particular geography aren’t on the market, so indices are constructed in order to monitor fluctuations in local home values in aggregate.
So while it’s true that Median List Prices dropped in the second half of 2018 (and in January 2019), this hardly paints an accurate picture of price action. Bay Area Home Values have trended upwards.
Why did home sales decline in late 2018?
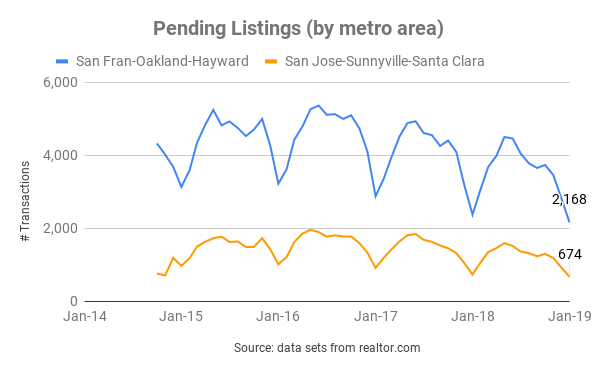
Home sales have declined over the past several months. Armageddon? Hardly. Several factors contributed to the drop in home sales and the drop in _Median List Pric_e: seasonality, higher borrowing costs in the second half of 2018, and buyer fatigue.
Seasonality.
Traditionally, residential real estate transactions follow a seasonal pattern (see chart below). Activity often peaks around summer and tapers off into December/January. Family considerations, school calendars, holidays, and historical precedent all figure in. Incidentally, as home prices reached new peaks in summer 2018, more sellers came to market in early autumn.

Affordability.
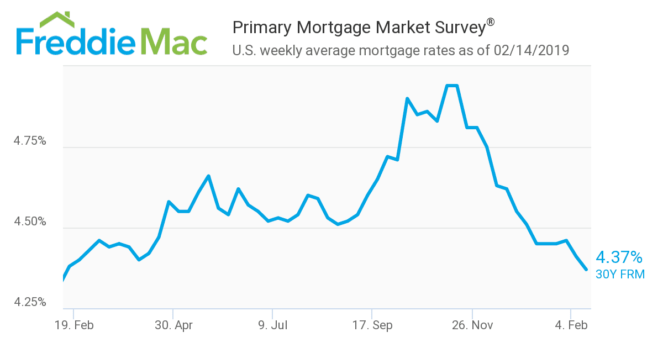
Home prices have increased steadily since their post-recession lows. To compound this, the cost of borrowing shot up. The rate on a 30-year fixed mortgage rose from around 4.5% in July to nearly 5% in November. An increase of 50 basis points increases the total cost of borrowing $400k by more than $43k over the full term of repayment. This means an increase in the monthly repayment of about $120 (excluding taxes, insurance, and incidentals like private mortgage insurance).

Buyer Fatigue.
The market context has favored sellers for a long time. Last year, some folks grew tired of placing offers on homes only to see their offers rejected time after time (you may have heard about “bidding wars”).
This confluence of factors - seasonality, decreasing affordability, and buyer fatigue - put a check on runaway price appreciation.
Local Economy
The Bay Area continues to experience a period of strong economic performance (though much work remains to address homelessness, growing financial disparity, and access to credit).
| Low Unemployment | Steady Job Creation | Strong Wage & Salary Growth | Inflation |
|---|---|---|---|
| 2.8% | 2.3% | 3.8% | 3.5% |
| Virtual full employment: the majority of those who are able and want to work can secure employment. | Many firms are actually challenged to find folks to hire in the current climate, according to California Dept. of Transport. | Real per capital income is expected to surpass $135k by 2023. | Above the national average, though down from the last release at 4.5%. |
| Source: BLS, DoT | Source: BLS, DoT | Source: BLS, DoT | Source: BLS |
Looking ahead…
(No major departure from our view last month.)
Home buying activity continues to increase month-on-month. The next few months are likely to see strong demand and rising prices (albeit at a moderate pace). This view is predicated on those factors covered above (lower mortgage rates and a lack of housing supply) as well as the strength of the local economy, seasonality, and the strong financial profile of local homebuyers.
A recession, a shock to the local economy, or a meaningful increase to the cost of borrowing could all negatively impact buyer demand. We see all three scenarios as unlikely in the short run.
Boomin’ local economy
The local economy is strong and continues to outperform most jurisdictions and the U.S. as a whole. Robust economic fundamentals contribute towards greater demand for homes.
High-season for home buying is underway
Early spring through autumn generally marks the high-season in residential real estate. Attractive properties that are priced appropriately are receiving multiple offers. Sellers are placing increased emphasis on the structure and negotiation of offers received. Naturally, buyers and sellers with best-in-class professional support will have an advantage.
Highly-qualified buyers
Wages and salaries in the Bay are higher than the state average - and expected to rise. By 2023, real per capita income in San Francisco County will exceed $135,000. Furthermore, homebuyers in San Francisco have amongst the strongest credit scores of any city in the nation.
Co-buying gets you more bang for your buck
Pooling resources to buy a home can be a great way to get a down payment together and to benefit from economies of scale. Every month, we illustrate the benefits of combined purchasing power with up-to-date market data.
In the example below, we assume:
- 10% down payment (not a hard requirement, many borrowers qualify with less)
- closing costs (buy-side) amount to 2.5% of the purchase price
- median list price for a 1-bed = $604k
- median list price for a 2-bed = $700k
- median list price for a 3-bed = $876k
- median list price for a 4-bed = $1,200k
Source: realtor.com data for SF-Oakland-Hayward Metro as of April 2019
Economies of Scale
| Flying solo | Teaming up to co-buy |
|---|---|
| single buyer / 1 bedroom home | 3 co-buyers / 3 bedroom home |
| A single buyer would need $76k in cash up front for down payment and closing costs. | Three co-buyers would need to each contribute $37k up front for down payment and closing costs. |
Breaking it down…

On a per-bedroom basis, purchasing a three-bedroom home in the SF-Oakland-Hayward metro is currently 52% cheaper than purchasing a one-bedroom home. Economies of scale are real! Co-buying can deliver more bang for your buck and provide greater optionality.
Related Posts
Curious about co-buying?
We're here to help, seven days a week.
