Bay Area Housing Market Update - Mar'19

Springin’ Forward
As I write this month’s Bay Area housing market update, the sun is shining gloriously across the East Bay. Spring is on its way. Spring is traditionally a busy season for residential real estate, and we are already seeing the signs of increased activity.
In our update last month, we looked at how market dynamics evolved over the course of 2018 and into this year. Building on that analysis, we expect to see activity heat up around the Bay over the coming months. Buyer fatigue and increased borrowing costs called skyrocketing home prices into check last year. Our view takes into account pent up demand, fresh demand/seasonality, scarce supply, reduced borrowing costs, and a strong local economy.
From conversations with our clients and our network of CoBuy-certified™ Pros, it is clear that many folks (understandably) are looking at how to approach the buy vs. rent decision. We frequently encounter three common misconceptions about what is required to purchase a home:
- A down payment of 20% is required
- “Perfect” credit is required
- Student loan debt has to be (or should always be) paid off before buying a home
None of these is accurate:
- The average U.S. homebuyer under 40 years old puts down 8.8%, and many buyers qualify for substantially lower down payments.
- Numerous programs exist for borrowers who have less than “perfect” credit scores.
- The existence of outstanding student loan debt does not preclude one from buying a home.
As always, there are many factors at play here. We will be covering these and other topics in upcoming posts, but if you are itching for answers we would love to hear from you.
-Team CoBuy
Price action
Home prices and values are measured in different ways. Many factors influence movements in these levels from month to month, and from one locale to the next. Both home prices and home values reflect signs of “buyer fatigue” on one hand, while fundamentals could exert upward pressure. Last year we saw substantial volatility across the Bay (see last month’s update for more).
Bay Area Median List Prices: bounced in February
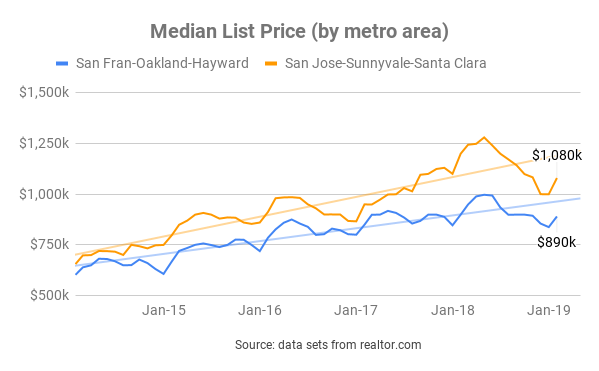
Let’s start by looking at the median list price for two Metropolitan Areas: the San Francisco-Oakland-Hayward Metropolitan Area and the San Jose-Sunnyvale-Santa Clara Metropolitan Area. In mid-2018, we saw a big spike in the median list price in both jurisdictions. Median list prices retraced their gains over the course of 2018, but are trending back upward in February.
Bay Area Median Sale Prices: mixed
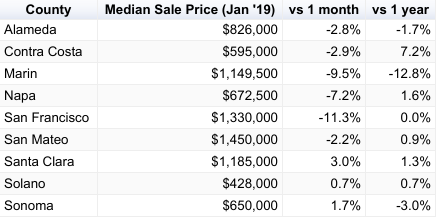
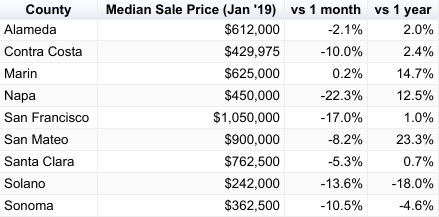
The last month for which we have median sale price data is January. January is typically one of the least active months in the year for home purchases.
Single Family Homes
Source: data from CAR
Condos/Townhomes
Source: data from CAR
We see a sizable monthly dip in median sale price across most counties, both in single family homes and condos/townhomes. But median sale price performance over a twelve month period tells a different story (for most counties listed). We expect the data for February and March to show month-on-month gains.
Bay Area Home Values: mixed performance
Below, we break out home value performance by city. It is evident that performance varies by jurisdiction. Again, note: the latest month for which data is available is January. January is typically one of the least active months in the year for home purchases.
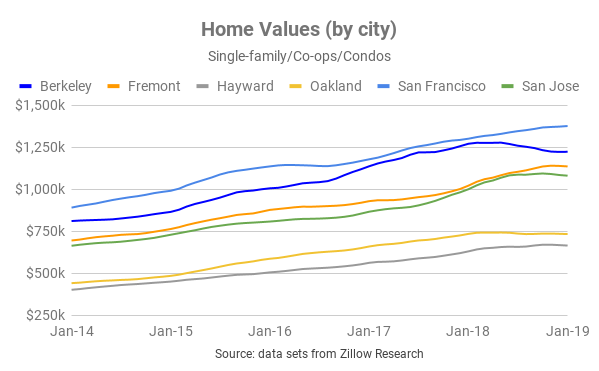
If we look at changes in home values over a twelve month period (through Jan 2019), we see strong performance in all but Berkeley and Oakland. This excludes numbers from February, which we would expect to be higher.

Jargon Busting
List Price: the price at which a seller advertises a property for sale on the market.
Sale Price: the price at which a seller and a buyer agree to transact. The median sale price for a given data set is the price “in the middle” of all sale prices when arranged in order of value. Referencing the median sale price instead of the mean sale price is useful as it reduces skew from outlying data points.
Home Value: a proxy for the value of a property, or how much it is “worth”. Ultimately, the true determination of value can only be established through transacting. Most homes in a particular geography aren’t on the market, so indices are constructed in order to monitor fluctuations in local home values in aggregate.
Supply & Demand
Somewhat predictably, there are signs of increases on both the supply side and the demand side. A key factor is seasonality: historically there are fewer homes bought and sold during the December and January months. Furthermore, last year we saw mortgage rates increase into year end. This had a clear impact on the demand side of the equation. Many would-be buyers decided to put their purchases on hold in light of sustained price increases and a higher cost of borrowing. Mortgage rates have since decreased notably, making a home purchase relatively more affordable for anyone taking out a mortgage.
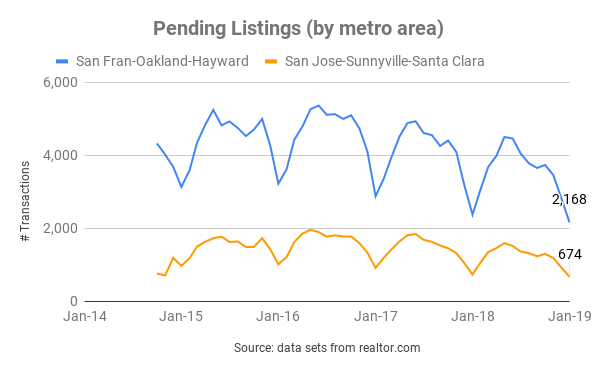
Increase in the number of transactions in February
February saw a jump in the number of homes that went under contract between buyers and sellers (pending listings increased). Pending listings are a forward indicator of home sales: the majority of these mutually accepted purchase and sale agreements will soon close.
Increase in inventory in February
The number of homes for sale increased in February.
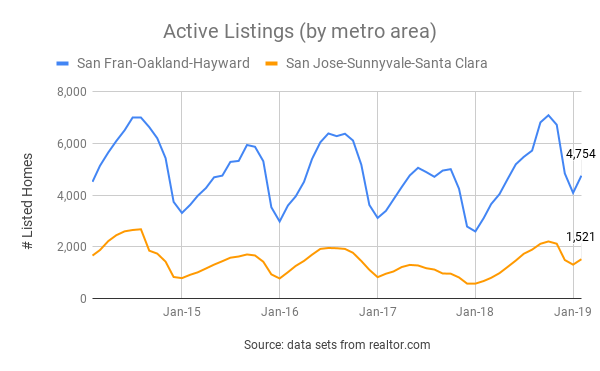
Inventory still remains rather lean by traditional standards. Months of inventory, a proxy for how long it would take for all existing homes on the market to be sold, is low in both the SF Metro (1.7 months of inventory) and the SJ Metro (1.5 months of inventory). Traditionally, a balanced market is characterized by months of inventory between 5 and 6 months. Still, the Bay Area housing markets can hardly be characterized as traditional. Between the third quarter of 2014 and the third quarter of 2018, months of inventory clocked in at even tighter levels versus today (but…for most of that period, prices were increasing.)
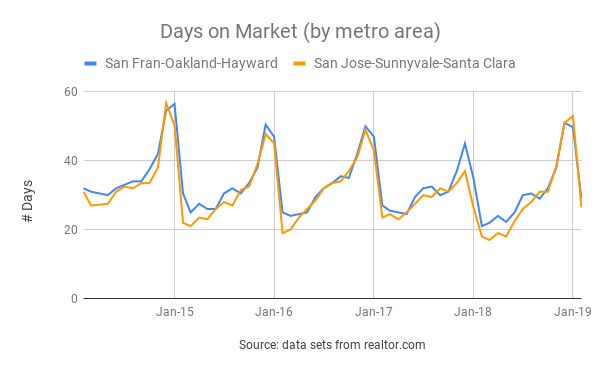
Homes sold at a faster pace in February
The number of days it takes for the average home to sell nearly halved from January to February of this year in both the San Francisco Metro Area (29 days in February) and the San Jose Metro Area (27 days in February). This compares to a national average of 83 days. This is supportive of strong demand for homes from buyers across the Bay Area.
Local Economy
The Bay Area continues to experience a period of strong economic performance (though much work remains to address homelessness, growing financial disparity, and access to credit).
| Low Unemployment | Steady Job Creation | Strong Wage & Salary Growth | Inflation |
|---|---|---|---|
| 2.8% | 2.3% | 3.8% | 3.5% |
| Virtual full employment: the majority of those who are able and want to work can secure employment. | Many firms are actually challenged to find folks to hire in the current climate, according to California Dept. of Transport. | Real per capital income is expected to surpass $135k by 2023. | Above the national average, though down from the last release at 4.5%. |
| Source: BLS, DoT | Source: BLS, DoT | Source: BLS, DoT | Source: BLS |
Looking ahead…
(No major departure from our view last month.)
Home buying activity continues to increase month-on-month. The next few months are likely to see strong demand and rising prices (albeit at a moderate pace). This view is predicated on those factors covered above (lower mortgage rates and a lack of housing supply) as well as the strength of the local economy, seasonality, and the strong financial profile of local homebuyers.
A recession, a shock to the local economy, or a meaningful increase to the cost of borrowing could all negatively impact buyer demand. We see all three scenarios as unlikely in the short run.
Boomin’ local economy
The local economy is strong and continues to outperform most jurisdictions and the U.S. as a whole. Robust economic fundamentals contribute towards greater demand for homes.
High-season for home buying is underway
Early spring through autumn generally marks the high-season in residential real estate. Attractive properties that are priced appropriately are receiving multiple offers. Sellers are placing increased emphasis on the structure and negotiation of offers received. Naturally, buyers and sellers with best-in-class professional support will have an advantage.
Highly-qualified buyers
Wages and salaries in the Bay are higher than the state average - and expected to rise. By 2023, real per capita income in San Francisco County will exceed $135,000. Furthermore, homebuyers in San Francisco have amongst the strongest credit scores of any city in the nation.
Co-buying gets you more bang for your buck
Pooling resources to buy a home can be a great way to get a down payment together and to benefit from economies of scale. Every month, we illustrate the benefits of combined purchasing power with up-to-date market data.
In the example below, we assume:
- 10% down payment (not a hard requirement, many borrowers qualify with less)
- closing costs (buy-side) amount to 2.5% of the purchase price
- median list price for a 1-bed = $604k
- median list price for a 2-bed = $700k
- median list price for a 3-bed = $876k
- median list price for a 4-bed = $1,200k
Source: realtor.com data for SF-Oakland-Hayward Metro as of April 2019
Economies of Scale
| Flying solo | Teaming up to co-buy |
|---|---|
| single buyer / 1 bedroom home | 3 co-buyers / 3 bedroom home |
| A single buyer would need $76k in cash up front for down payment and closing costs. | Three co-buyers would need to each contribute $37k up front for down payment and closing costs. |
Breaking it down…

On a per-bedroom basis, purchasing a three-bedroom home in the SF-Oakland-Hayward metro is currently 52% cheaper than purchasing a one-bedroom home. Economies of scale are real! Co-buying can deliver more bang for your buck and provide greater optionality.
Related Posts
Curious about co-buying?
We're here to help, seven days a week.
