Greater Seattle Housing Market Update - Feb '19

Year of the Pig
The Year of the Pig is officially underway, and with it a “…lucky lunar cycle inclined to bring prosperity and wealth.” We examine the latest data and key drivers likely to impact housing markets around the Puget Sound in the months ahead.
-Team CoBuy
Price appreciation has slowed.
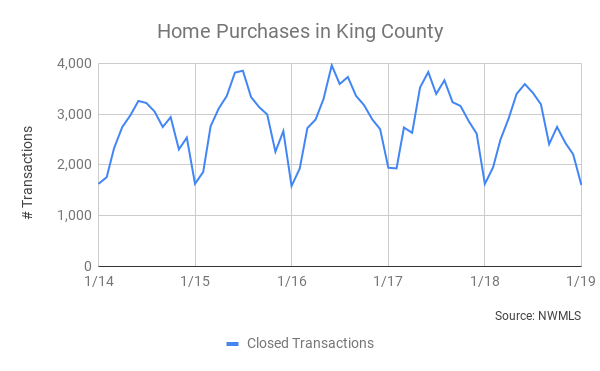
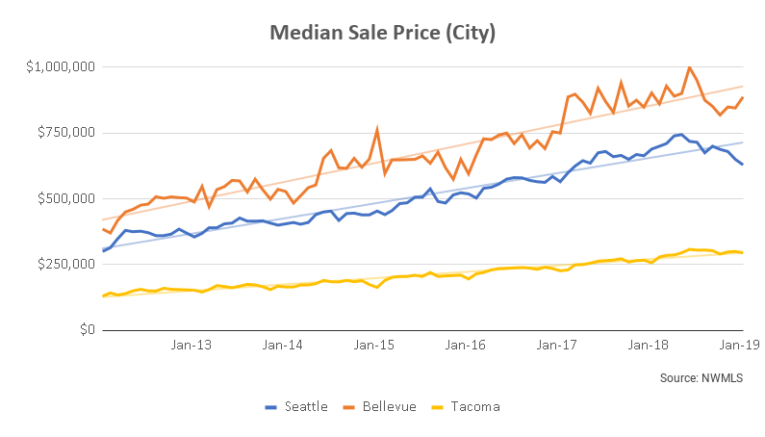
The first half of last year saw cut-throat competition amongst buyers that was characterized by bidding wars and super-constrained supply. Prices peaked in the summer months, which typically see the highest number of transactions. Optically, Median Sale Prices for cities across the Puget Sound declined from their summer peaks through the end of 2018 - to varying degrees. This was most pronounced in the city of Seattle.

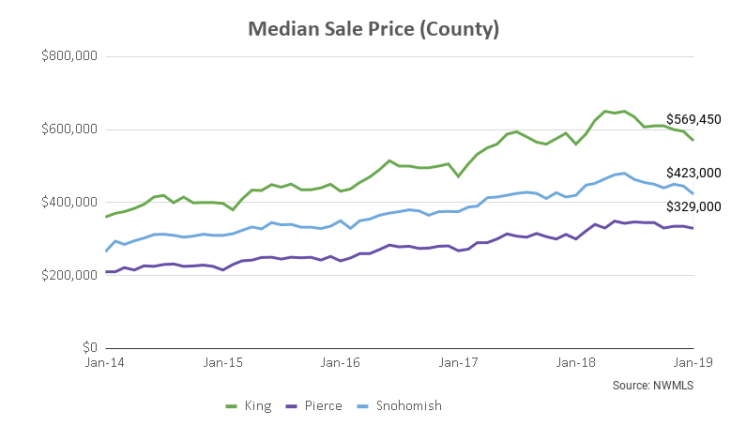
At the county level, Median Sales Prices rose between January 2018 and January 2019. In King County, the Median Sales Price increased 1.7% over the last twelve months. Pierce and Kitsap counties outperformed: their respective Median Sales Prices saw impressive increases.
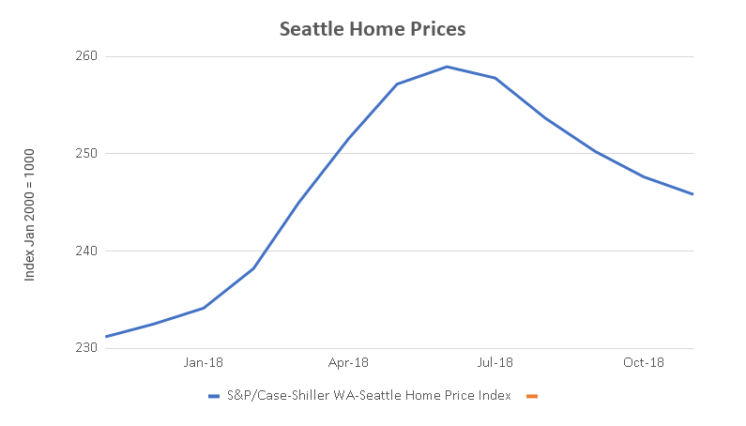
While the Median Sales Price for Seattle is down both month-on-month and year-on-year, home value indices show Seattle house prices actually gained ground over the last twelve months: the S&P/Case-Shiller Seattle Home Price index rose 6.3% in the twelve months through November 2018. (Note: home value indices take into account the type and quality of housing stock being transacted so as to provide a holistic view on fluctuations to home prices.)
Jargon Busting
List Price: the price at which a seller advertises a property for sale on the market.
Sale Price: the price at which a seller and a buyer agree to transact. The median sale price for a given data set is the price “in the middle” of all sale prices when arranged in order of value. Referencing the median sale price instead of the mean sale price is useful as it reduces skew from outlying data points.
Home Value: a proxy for the value of a property, or how much it is “worth”. Ultimately, the true determination of value can only be established through transacting. Most homes in a particular geography aren’t on the market, so home price indices are constructed in order to monitor fluctuations in local home values.
So while a few ambitious journalists recently had a field day declaring tanking home prices, this hardly paints an accurate picture of price action. Over the past year, Seattle outperformed most major metros, the 20-city composite index, and the nation as a whole. To put things in perspective, the S&P Case-Shiller Seattle Home Price Index is up 90.6% from the post-recession lows recorded in 2012.
Why did home prices dip after peaking in summer 2018?
Seasonality.
Traditionally, the highest number of transactions occur during the early summer months while January is the slowest time of year. Family considerations, school calendars, religious holidays, and historical precedent all figure in. Incidentally, as home prices reached new peaks in summer 2018, more sellers came to market in early autumn.
Affordability.
Home prices have increased steadily since their post-recession lows (see trendlines below). In the first six months of 2018, Median Sale Prices increased big time in Seattle (+8%), Bellevue (+11%), and Tacoma (+20%). Buying a home became even more expensive.
To compound this, the cost of borrowing shot up. The rate on a 30-year fixed mortgage rose from around 4.5% in July to nearly 5% in November. An increase of 50 basis points increases the total cost of borrowing $400k by more than $43k over the full term of repayment. This means an increase in the monthly repayment of about $120 (excluding taxes, insurance, and incidentals like private mortgage insurance).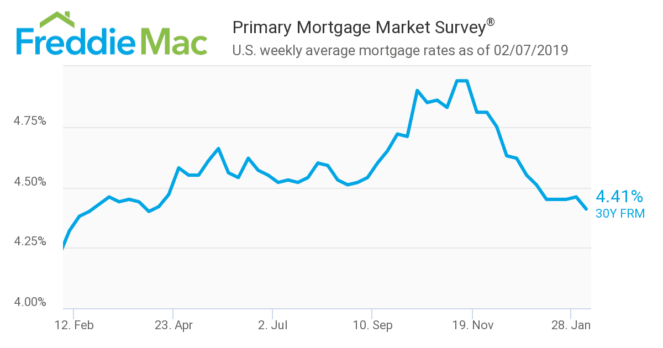
Buyer Fatigue.
The market context has favored sellers for a long time. We are seeing a rebalancing of the supply/demand dynamic now (more on that later), but by mid-2018 many folks grew tired of placing offers on homes only to see their offers rejected time after time. These “bidding wars” often required prospective buyers to pay for a pre-inspection ahead of time, with no guarantee their offer would be accepted by the seller.
This confluence of factors - seasonality, decreasing affordability, and buyer fatigue - put a check on runaway price appreciation. On the whole, home prices have retreated from their pronounced peaks over a short time horizon.
Looking ahead…
Homebuying activity is likely to pick up across Greater Seattle over the coming months. We anticipate more listings coming to market, increased demand from buyers, and rising prices (albeit at a slower pace). This view is predicated on the strength of the local economy, seasonality, low(er) mortgage rates, and supply/demand dynamics.
Boomin’ local economy
As we touched on in last month’s update, the local economy is strong and continues to outperform most jurisdictions and the U.S. as a whole. The Seattle Metro Area has low unemployment at 3.8%, a job market expanding at a rapid 3.3%, and robust wage & salary growth at 3.7%. It’s clear that much work remains to be done in terms of tackling homelessness, growing financial disparity, and equitable access to credit. Separately, it is clear that strong underlying economic fundamentals contribute towards greater demand for homes.
High-season for homebuying
Early spring through summer generally marks the high-season for home purchases. We expect the effects of seasonality to be magnified this year. Anecdotally, we are already seeing and hearing of folks who experienced buyer fatigue last year deciding to kickstart their home search now. Attractive properties that are priced appropriately are receiving multiple offers.
Sellers are placing increased emphasis on the structure and negotiation of offers received. Naturally, buyers and sellers with best-in-class professional support will have a relative competitive advantage.
Lower mortgage rates
At the time of writing, mortgage rates are at a ten-month low: the average rate on a 30-year fixed rate mortgage is 4.41%. Freddie Mac’s Chief Economist Sam Khater sees this drop in the cost of borrowing as likely to stimulate demand:
“The U.S. economy remains on solid ground, inflation is contained and the threat of higher short-term rates is fading from view, which has allowed mortgage rates to drift down to their lowest level in 10 months. This is great news for consumers who will be looking for homes during the upcoming spring homebuying season. Mortgage rates are essentially similar to a year ago, but today’s buyers have a larger selection of homes and more consumer bargaining power than they did the last few years.”
Too few homes, highly-qualified buyers
The lack of housing supply has reached the point of crisis at the local, regional, and national levels. Greater Seattle faces its own unique headwinds. Building out is challenging as we are bordered by waterways and mountain ranges. Antiquated zoning laws dictate that the majority of residentially-zoned land in Seattle itself is reserved for single-family homes. And like major metropolitan areas around the country, the cost of building new homes in Seattle has risen substantially.
And then there’s the fact that the population is growing faster than the number of housing units.
King County (2010-2018)
+13.4%
Population
Source: State of Washington OFM
+10.0%
Housing units
Source: State of Washington OFM
Last but not least, Seattle homebuyers are some of the most competitive in the nation in terms of credit scores, available funds for down payment, and incomes.
Hottest local markets
Supply & demand around Greater Seattle by Zip Code
Property markets are highly-localized, by definition. The difference in a few city blocks can determine school district and proximity to transport, amongst a host of other factors. Many of the geographies surrounding Seattle and even King County have seen their home price appreciation outperform Seattle proper over the past year.
Here’s a heat map of the “hottest zip codes” around the Seattle Metro area right now. We base this on data from realtor.com which evaluates zip codes within a given metro based on key determinants of supply and demand.

## Co-buying gets you more bang for your buck
**Pooling resources to buy a home can be a great way to get a down payment together and to benefit from economies of scale. Every month, we illustrate the benefits of combined purchasing power with up-to-date market data.**
In the example below, we assume:
* 10% down payment (not a hard requirement, many borrowers qualify with less)
* closing costs (buy-side) amount to 2.5% of the purchase price
* median list price for a 1-bed = $604k
* median list price for a 2-bed = $700k
* median list price for a 3-bed = $876k
* median list price for a 4-bed = $1,200k
Source: realtor.com data for SF-Oakland-Hayward Metro as of April 2019
## Economies of Scale
| Flying solo | Teaming up to co-buy |
|---|---|
| single buyer / 1 bedroom home | 3 co-buyers / 3 bedroom home |
| A single buyer would need $76k in cash up front for down payment and closing costs. | Three co-buyers would need to each contribute $37k up front for down payment and closing costs. |
Breaking it down…
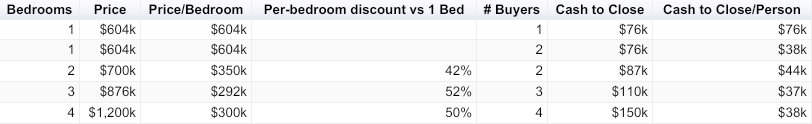
On a per-bedroom basis, purchasing a three-bedroom home in the SF-Oakland-Hayward metro is currently 52% cheaper than purchasing a one-bedroom home. Economies of scale are real! Co-buying can deliver more bang for your buck and provide greater optionality.
Related Posts
Curious about co-buying?
We're here to help, seven days a week.
