Bay Area Housing Market Update - April 2019
Sometimes the questions are complicated, and the answers are simple.
-Dr. Seuss
If you’ve been following the press recently, you know that the IPO bonanza is the talk of the town. Headlines suggest that a series of upcoming initial public offerings will cause home prices to soar across the Bay as thousands of new millionaires pour capital in the local housing markets.
We see three themes driving Bay Area housing markets over the coming months:
- ‘IPO mania’
- The cost of borrowing
- Supply & demand
Activity has picked up as it traditionally does this time of year. Desirable homes in San Francisco and the East Bay are receiving multiple offers and selling for up to 10% (or more) above list price, sometimes in under two weeks. We stick to our core views, which continue to find good support. We expect local home prices to continue to rise over the medium term in the absence of external shocks. Housing markets around the Bay Area remain amongst the most competitive in the country. Buyers should plan accordingly.
Thorough preparation, financing approval, and a clearly-defined strategy should all be considered prerequisites to kicking off a property search. Guidance and support from an experienced deal team of real estate professionals will be a distinct advantage in the current market context.
Buying a home together in the Bay?
Learn how CoBuy makes it easier, more fun, and better protected.
‘IPO mania’
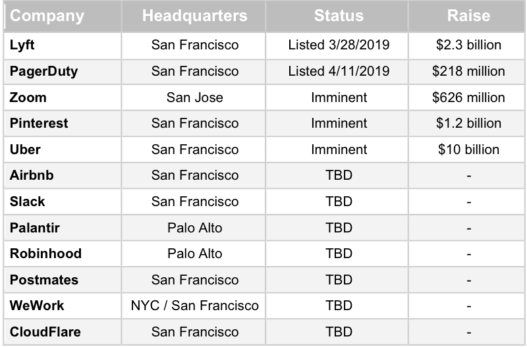
It’s a big year for IPOs. Following Lyft’s recent public offering, Pinterest, Zoom, Uber, Airbnb, Slack, Palantir, Robinhood, Postmates, and WeWork are all slated to list on public stock exchanges over the coming months. Journalists everywhere are busy detailing how liquidity events will see thousands of early employees at these companies based around the Bay minted overnight. Flush with cash, it is said, these folks will be looking to buy homes. The tidal wave of demand will exacerbate already squeezed Bay Area housing markets and cause home prices to soar. But how likely is this?
Tech IPOs in 2019
Several studies have examined the effects of past IPOs on Bay Area home prices. It’s safe to say that following a series of wealth-creating liquidity events, you’re going to see increased demand for homes. All else equal, increased demand should put upward pressure on home prices. However, we believe that ‘IPO-mania’ is overhyped.
Not all of the money being raised will wind up in the pockets of these companies’ Bay-based employees. Institutional investors, founding team members, and the tax man will benefit the most. Then there is the lockup period that restricts how soon after the IPO employees can sell their shares. When employees do cash in, not all will be receiving humongous lump sums. Moreover, those who do choose to invest their new capital into homes are unlikely to be synchronized in their timing, geographic focus, and price points. Finally, it’s likely that markets have already at least partially priced in the impacts of these IPOs. News of these offerings entered the public domain many months ago.
The cost of borrowing
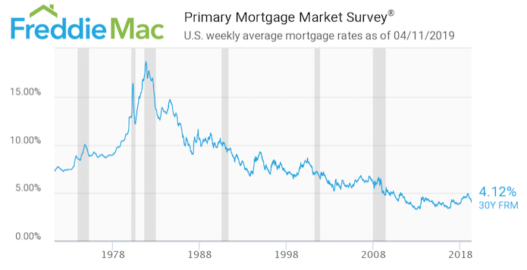
Financing is (and will remain) the major hurdle to homeownership in the U.S. Roughly nine in ten U.S. homebuyers get a mortgage to finance the purchase of a home, according to NAR data. Consequently, fluctuations in mortgage rates have a significant impact on the level of demand from buyers.
Mortgage rates today are far nearer their historical lows than their historical peaks.
Let’s look at things over a shorter horizon. The average rate on a 30-year fixed rate mortgage increased by about 1% over the course of 2018.
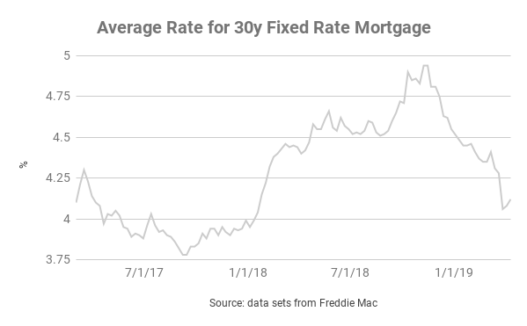
Increased borrowing costs combined with higher prices took their toll around the middle of 2018 when Median List Prices began to fall. After peaking in November, the average rate on a 30 year fixed rate mortgage has fallen by over 75 basis points. Unsurprisingly, as mortgage rates have come down, median list prices in the Bay have increased.
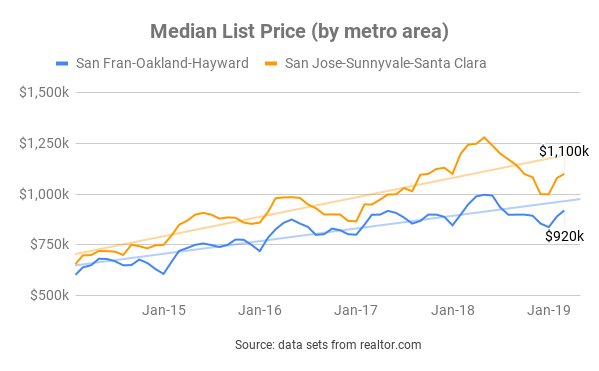
Example:
To illustrate the effects of this fall in mortgage rates, let’s look at an example where a CoBuy group in the SF-Oakland-Hayward Metropolitan Area purchases a home at the Median List Price of $920k with 20% down with a 30y fixed-rate mortgage.
Scenario 1: CoBuy group borrows $736k at 5.000%
- Total cost of mortgage: $1,422,363
- Monthly payments: $3,951
Scenario 2: CoBuy group borrows $736k at 4.125%
- Total cost of mortgage: $1,284,128
- Monthly payments: $3,567
Note: we assume the purchase price is static at $920k for simplicity.
Depending on whether our hypothetical CoBuy group bought around November 2018 or recently, monthly repayments and the total cost of the mortgage could be substantially lower (by $384 per month and $138k over the term, respectively). Swings in the cost of borrowing drastically alter affordability.
The Federal Reserve has adopted a ‘patient’ approach to monetary policy in 2019. The January meeting marked a shift towards a distinctly dovish tone. The minutes from the Fed’s March meeting leave the door open for rate hikes this year despite “a majority of participants” expecting to remain on hold throughout 2019. Absent any hikes from the Fed this year, we could see mortgage rates remaining lower for longer. According to Freddie Mac, “lower mortgage interest rates combined with a strong labor market should attract prospective homebuyers this spring.”
Supply & Demand
On the supply side, the Bay Area has a severe shortage of housing. According to the California Department of Transportation, “housing production is not keeping pace with population growth.”
Alameda County (2010-2018)
+9.9%
Population
Source: CA Dept. of Finance
+3.6%
Housing units
Source: CA Dept. of Finance
San Francisco County (2010-2018)
+9.8%
Population
Source: CA Dept. of Finance
+5.6%
Housing units
Source: CA Dept. of Finance
Regulation, sky-rocketing construction costs, and an accrued housing deficit are mitigating factors.
On the demand side, a robust local economy continues to post job growth and bolster the finances of many (though sadly not all) residents who live and work in cities around the Bay. This imbalance will continue to challenge the Bay Area for the foreseeable future.
Price action
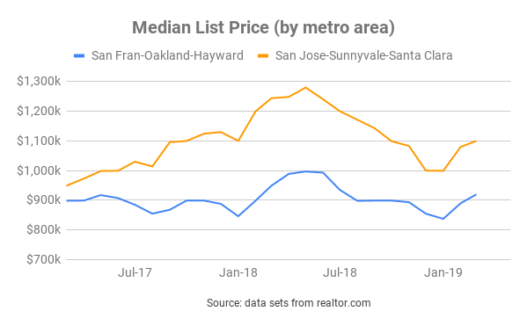
Bay Area Median List Prices: on the rise
After peaking in the middle of 2018, prices declined through year end. Median list prices in both the San Francisco-Oakland-Hayward metro and the San Jose-Sunnyvale-Santa Clara metro have increased by 10% since the start of 2019.
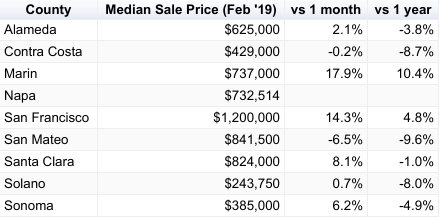
Bay Area Median Sale Prices: mixed
The last month for which we have median sale price data is February. San Francisco County saw strong month-on-month gains in February and we expect median sale prices to continue to track upwards over the next several months.
Single Family Homes

Source: data from CAR
Condos/Townhomes
Source: data from CAR
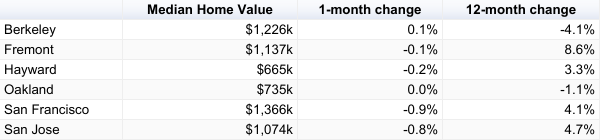
Bay Area Home Values: mixed performance
Below, we break out home value performance by city. Home value appreciation was flat to moderately down in February, the latest month for which we have data. We expect home values to trend upwards in the months ahead.
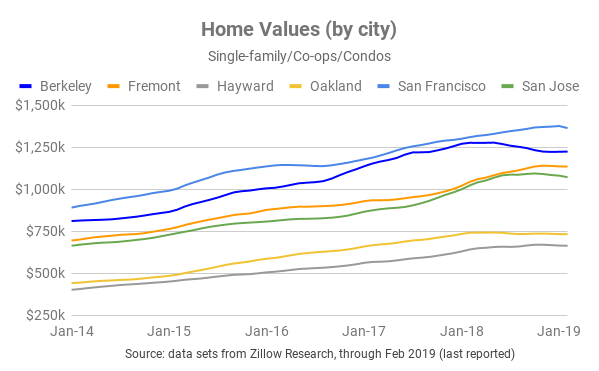
If we look at changes in home values over a twelve month period (through February 2019), we see decent performance in all but Berkeley and Oakland.
Jargon Busting
List Price: the price at which a seller advertises a property for sale on the market.
Sale Price: the price at which a seller and a buyer agree to transact. The median sale price for a given data set is the price “in the middle” of all sale prices when arranged in order of value. Referencing the median sale price instead of the mean sale price is useful as it reduces skew from outlying data points.
Home Value: a proxy for the value of a property, or how much it is “worth”. Ultimately, the true determination of value can only be established through transacting. Most homes in a particular geography aren’t on the market, so indices are constructed in order to monitor fluctuations in local home values in aggregate.
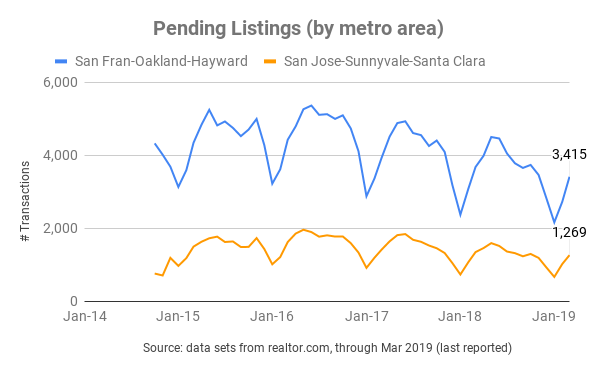
Supply & Demand
More sellers and buyers reached mutual acceptance in March
In last month’s update, we called for a spike in activity. The data did not disappoint. Pending listings for March were up almost 25% month-on-month in both the SF and SJ metro areas. We expect active markets into the summer months, particularly in light of cheaper credit. Risk factors remain i) hints of rate hikes from the Fed ii) dramatic price increases as seen in the first half of 2018 iii) equity market under performance.
Inventory of homes increased in March
The number of homes for sale increased in March, but inventory is still lean.
Months of inventory, a proxy for how long it would take for all existing homes on the market to be sold, is low in both the SF Metro (1.5 months) and the SJ Metro (1.4 months). Traditionally, a balanced market is characterized by 5-6 months of inventory. While the five year average for the San Francisco and San Jose metro areas is just over one month, the supply/demand imbalance over this period is at least partially to blame for runaway prices.

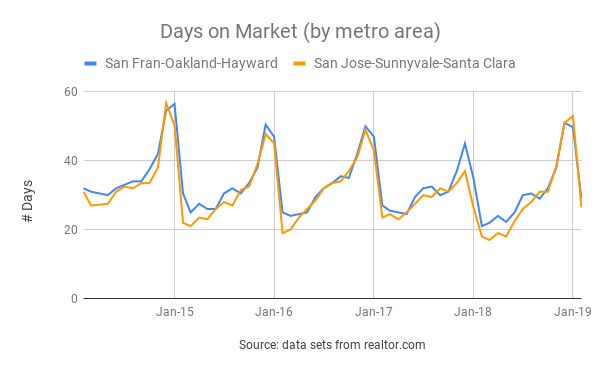
Homes are not on the market for long
The average home in both the San Francisco-Oakland-Hayward metro and the San Jose-Sunnyvale-Santa Clara metro takes just under 30 days to sell. At the moment, it is not uncommon for the most desirable properties in San Francisco/East Bay to sell in just two weeks. Nationally, the average home is on the market for 63 days.
Despite above average inventory for this time of year, the market is clearly digesting supply without any problem.
Local Economy
The Bay Area continues to experience a period of strong economic performance (though much work remains to address homelessness, growing financial disparity, and access to credit).
| Low Unemployment | Steady Job Creation | Strong Wage & Salary Growth | Inflation |
|---|---|---|---|
| 2.8% | 2.3% | 3.8% | 3.5% |
| Virtual full employment: the majority of those who are able and want to work can secure employment. | Many firms are actually challenged to find folks to hire in the current climate, according to California Dept. of Transport. | Real per capital income is expected to surpass $135k by 2023. | Above the national average, though down from the last release at 4.5%. |
| Source: BLS, DoT | Source: BLS, DoT | Source: BLS, DoT | Source: BLS |
Looking ahead…
(No major departure from our view last month.)
Home buying activity continues to increase month-on-month. The next few months are likely to see strong demand and rising prices (albeit at a moderate pace). This view is predicated on those factors covered above (lower mortgage rates and a lack of housing supply) as well as the strength of the local economy, seasonality, and the strong financial profile of local homebuyers.
A recession, a shock to the local economy, or a meaningful increase to the cost of borrowing could all negatively impact buyer demand. We see all three scenarios as unlikely in the short run.
Boomin’ local economy
The local economy is strong and continues to outperform most jurisdictions and the U.S. as a whole. Robust economic fundamentals contribute towards greater demand for homes.
High-season for home buying is underway
Early spring through autumn generally marks the high-season in residential real estate. Attractive properties that are priced appropriately are receiving multiple offers. Sellers are placing increased emphasis on the structure and negotiation of offers received. Naturally, buyers and sellers with best-in-class professional support will have an advantage.
Highly-qualified buyers
Wages and salaries in the Bay are higher than the state average - and expected to rise. By 2023, real per capita income in San Francisco County will exceed $135,000. Furthermore, homebuyers in San Francisco have amongst the strongest credit scores of any city in the nation.
Co-buying gets you more bang for your buck
Pooling resources to buy a home can be a great way to get a down payment together and to benefit from economies of scale. Every month, we illustrate the benefits of combined purchasing power with up-to-date market data.
In the example below, we assume:
- 10% down payment (not a hard requirement, many borrowers qualify with less)
- closing costs (buy-side) amount to 2.5% of the purchase price
- median list price for a 1-bed = $604k
- median list price for a 2-bed = $700k
- median list price for a 3-bed = $876k
- median list price for a 4-bed = $1,200k
Source: realtor.com data for SF-Oakland-Hayward Metro as of April 2019
Economies of Scale
| Flying solo | Teaming up to co-buy |
|---|---|
| single buyer / 1 bedroom home | 3 co-buyers / 3 bedroom home |
| A single buyer would need $76k in cash up front for down payment and closing costs. | Three co-buyers would need to each contribute $37k up front for down payment and closing costs. |
Breaking it down…
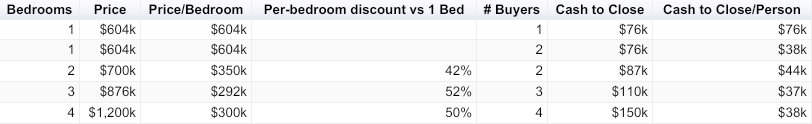
On a per-bedroom basis, purchasing a three-bedroom home in the SF-Oakland-Hayward metro is currently 52% cheaper than purchasing a one-bedroom home. Economies of scale are real! Co-buying can deliver more bang for your buck and provide greater optionality.
Related Posts
Curious about co-buying?
We're here to help, seven days a week.
