Bay Area Housing Market Update – May 2019

If you invest the time earlier to create structure and process around communication, planning, and goal setting, you can prevent missteps before they occur.
- Christine Tsai
The month of May holds unique significance for each of us. Some pay tribute to small businesses, others pump up their tires for National Bike Month, and many decide to kick off the search for a new home.
At CoBuy, we help people buy homes together, intelligently. For social and financial reasons, purchasing a home with friends, family, or a partner is increasingly common in the U.S. This is particularly true in the Bay area, where housing costs are higher than almost anywhere else in the nation. But buying a home with friends, family, or your partner introduces unique challenges and risks - both during the purchase process and the co-ownership period that follows. The competitive nature of local housing markets magnifies the importance of having a solid plan and excellent professional support.
Enter CoBuy.
Every month, we break down market trends and data in our Bay Area Housing Market Update. We strive to produce objective updates that provide co-buyers unadulterated insight into the latest housing market developments. Much of what is published in the press and by industry players is heavily biased. That isn’t particularly helpful if you’re deciding whether or not to pull the trigger on buying a home together. We aren’t trying to sell anyone on co-buying a home. We’re here to help people who want to co-buy and co-own to do it intelligently. This starts with having the right information.
In recent months, our views have frequently clashed with those pushed in the headlines. Ironically, most of these views have found strong empirical support. We do not have a crystal ball, and we are skeptical of anyone who claims to own one. We base our views and analysis on decades of real estate and finance experience, data, collaboration with our network of CoBuy-certified™ Pros, and our involvement in the market.
We hope you find this month’s update informative. If you are considering buying a home with friends, family, or your partner around the Bay, we invite you to get in touch.
At a glance
Prices and activity are up month-on-month in the San Francisco-Oakland-Hayward Metropolitan Area, while the number of days a home is on the market decreased by one day. This is in line with our expectations and is a function of increased demand, seasonality, and favorable borrowing costs.
San Francisco-Oakland-Hayward Metro Area
| Median List Price | $948,295 (+3% vs. last month) |
| Pending Listings | 4,085 properties (+20% vs. last month) |
| Days on Market | 28 days (-1 day vs. last month) |
Markets around the Bay are hyper competitive. Lower mortgage rates coupled with continued wage growth continue to spur homebuyer interest. We are seeing strong demand and brisk activity, which is particularly intense at lower price points and along major transitroutes.
Buyer demand is tiered, with homes listed at price points of up to $1.5 million experiencing the heaviest foot traffic, receiving more offers on average, and staying on the market for fewer days on average. At all price points, well-priced properties are selling at or above the price at which they were listed. In some localities, properties are routinely listed at a price designed to stoke competition resulting in a sale at 10-15% (or more) above the asking price.
In context of the current market climate, there are steps that buyers can take to improve their positioning. Buyers should secure fully underwritten approval for financing before placing offers. It is also advisable to work with an agent who is well-versed in local market transaction dynamics. CoBuy builds in these and other measures to strengthen the competitiveness of the buyers we serve.
Opportunities do exist. One example, according to San Francisco CoBuy-certified™ Agent
Shelly Sutherland, can be found in properties that have been on the market for longer than 20 to 30 days. “In San Francisco, if a property does not sell in the first 21 days, things can become more challenging for the seller as sometimes the market can assign a stigma to the property. This stigma isn’t necessarily always warranted and it can present an opportunity for buyers,’” observes Sutherland.
Drivers
Last month we highlighted three themes that we see driving Bay area housing markets:
- ‘IPO mania’
- The cost of borrowing
- Supply & demand
The picture has evolved, but it has not drastically changed. We continue to see these as key drivers over the near term and beyond (more below).
The past month has yielded important new information on the health of the U.S. economy. An article dated May 4th in The Economist sums it up: ‘Fears of recession in America have faded’. Recent economic data has confirmed strong growth, a rebound in consumer confidence, low inflation, and the lowest unemployment in 50 years.
| Q1 GDP | Unemployment | Inflation (PCE Price Index) | CB Consumer Confidence Index |
|---|---|---|---|
| 3.2% | 3.6% | 1.6% | 129.2 |
After an extended period of growth, many media outlets, analysts, and investors have predicted a slowdown. As of writing, there is little evidence that America, Inc has started to falter. If anything, quite the opposite. The economy is growing and adding jobs while inflation remains below the 2% bright line. For the first time, the concern is that an excessively tight labor market could actually be the mitigating factor to the current period of extended expansion as companies struggle to source the talent they need to continue producing goods and services.
There are downside risks to the economy. Most notably, the ongoing trade dispute between the U.S. and China has resulted in uncertainty that has been reflected in the equity markets. We are optimistic that a resolution will be achieved as this would certainly be in the interest of both countries. However, escalation poses a threat to trade, growth, and business confidence.
‘IPO Mania‘
The year 2019 may well be referred to in future business schools case studies as ‘the year of the IPO.’ Cyclicality, investor cash cycles, and a desire to beat a downtown have prompted an unprecedented number of companies to schedule their public market debuts in 2019.
Tech IPOs in 2019
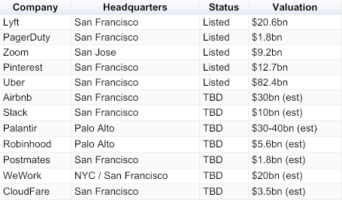
Many of these companies are either based in the Bay Area or have large numbers of employees based here. Consequently, there has been much speculation that the wealth created could spark a buying frenzy in local housing markets overnight. San Francisco city officials project that this could result in the median sale price in San Francisco increasing as much as 11.3% over the next 1-2 years.
We do think that these liquidity events will fuel demand for homes, but we believe this concern is somewhat overblown. Employees who receive equity awards are traditionally restricted from selling their shares (and thus realizing a gain) for six months following an initial public offering. However, the intention of many of these firms to go public has been in the public domain for some time. To some extent, it is likely the effects have been priced into the market. Furthermore, we understand that some local lenders are lending to borrowers against their equity. An upcoming instantaneous shock to demand becomes less likely, or at least smaller in magnitude.
The cost of borrowing
(Our view remains unchanged versus last month. Low inflation numbers and downward revisions to mortgage rates for the duration of 2019 reinforce our view.)
Financing is the major hurdle to homeownership, and nearly 9 in 10 buyers in America borrow to fund the purchase of a new home. Naturally, the cost of borrowing influences buyer demand.
At the time of writing, the contract rate for a 30-year fixed rate mortgage hovers near the one year low.
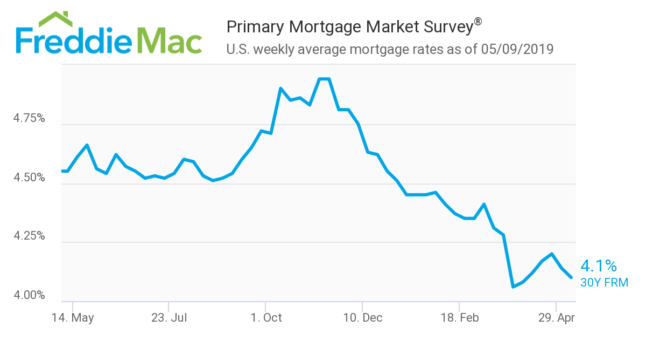
In historical context, the cost of borrowing is low. The scope for increased borrowing costs over the medium term - all else equal - remains high. This is a strong motivator for buyers mulling a purchase over the near-term to pull the trigger sooner, rather than later. In fact, low borrowing costs are a strong motivator for any aspiring homeowner who can muster the necessary financial inputs to pull the trigger.
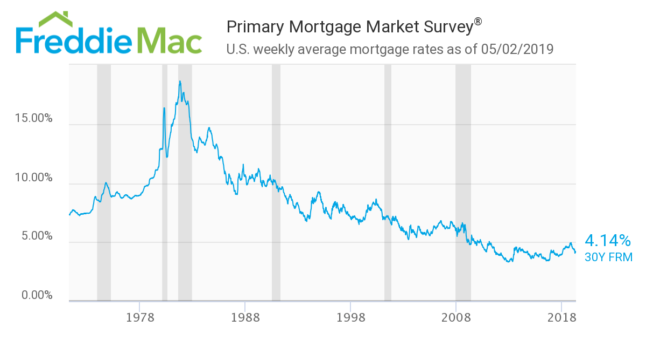
Freddie Mac, a government-sponsored enterprise that buys mortgages on the secondary market, has revised their 2019 full-year forecast for the rate on a 30-year fixed rate mortgage down to 4.3% (from 4.7% in January). This signifies an expectation of lower borrowing costs throughout 2019, which provides a boost to the demand for home purchases (all else equal).
Example:
To illustrate how the cost of borrowing impacts affordability, let’s look at an example where a CoBuy group in the SF-Oakland-Hayward Metropolitan Area purchases a home at the current Median List Price of $948k with 20% down and a 30y fixed-rate mortgage.
Scenario 1: CoBuy group borrows $758,400 at 4.300%
- Total cost of mortgage: $1,351,118
- Monthly payments: $3,753
Scenario 2: CoBuy group borrows $758,400 at 5.300%
- Total cost of mortgage: $1,516,115
- Monthly payments: $4,211
Note: we assume the purchase price is fixed at $948k for simplicity.
In this hypothetical example, a one point increase in the cost of borrowing equates to an additional $458 in monthly repayments or $165k over the full term. Swings in the cost of borrowing have meaningful implications for affordability.
Supply & Demand
Fundamentally, there exists a sizable imbalance between the demand for homes in the Bay area and the stock of available housing.
On the supply side, the Bay has a severe shortage of housing. According to the California Department of Transportation, “housing production is not keeping pace with population growth.”
Alameda County (2010-2018)
| Population | Housing units |
|---|---|
| +9.9% | +3.6% |
| Source: CA Dept. of Finance | Source: CA Dept. of Finance |
San Francisco County (2010-2018)
| Population | Housing units |
|---|---|
| +9.8% | +5.6% |
| Source: CA Dept. of Finance | Source: CA Dept. of Finance |
Regulation, sky-rocketing construction costs, and an accrued housing deficit are contributing factors.
Price action
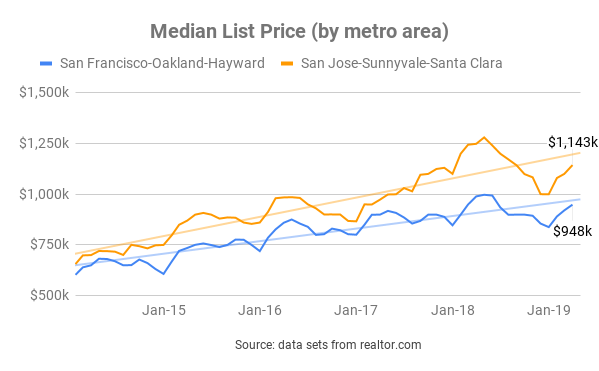
Bay Area Median List Prices: on the rise
After peaking in the middle of 2018, prices declined through year end. Since the start of 2019 we have seen the median list price for the San Francisco-Oakland-Hayward metro increase by over 13% and the median list price for the San Jose-Sunnyvale-Santa Clara metro increase by over 14%.
Bay Area Median Sale Prices: mixed
The last month for which we have median sale price data is March. San Francisco County saw strong month-on-month gains in March and we expect the median sale price to continue to track upwards over the next several months in San Francisco and Alameda counties.
Single Family Homes
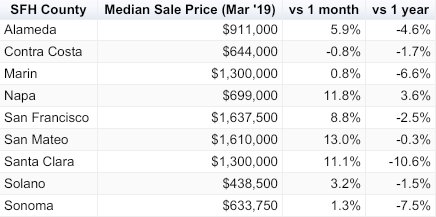
Source: data from CAR
Condos/Townhomes
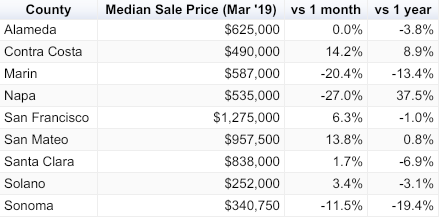
Source: data from CAR
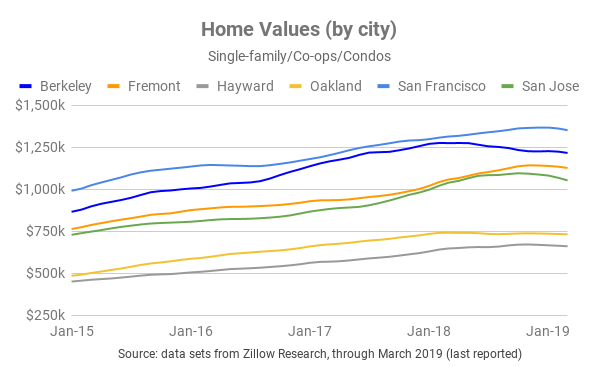
Bay Area Home Values: mixed performance (again)
Below, we break out home value performance by city. Home value indices were a touch softer in March, the latest month for which we have data. We expect home values to trend upwards in the months ahead in the absence of any pronounced external shocks.
Jargon Busting
List Price: the price at which a seller advertises a property for sale on the market.
Sale Price: the price at which a seller and a buyer agree to transact. The median sale price for a given data set is the price “in the middle” of all sale prices when arranged in order of value. Referencing the median sale price instead of the mean sale price is useful as it reduces skew from outlying data points.
Home Value: a proxy for the value of a property, or how much it is “worth”. Ultimately, the true determination of
value can only be established through transacting. Most homes in a particular geography aren’t on the market, so indices are constructed in order to monitor fluctuations in local home values in aggregate.
Supply & Demand
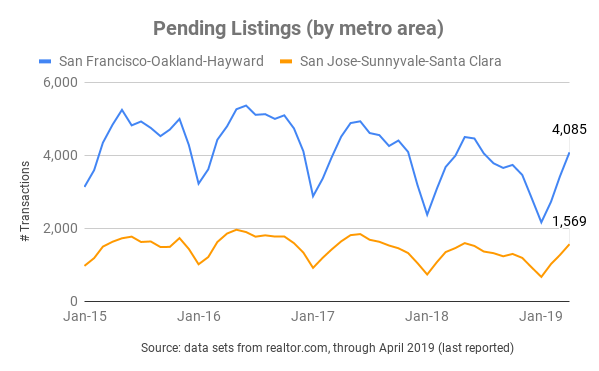
More sellers and buyers reached mutual acceptance in April
In line with our expectations, the number of properties that went pending last month continued to climb. Pending listings for April were up 20% in the San Francisco-Oakland-Hayward metro and 24% in the San Jose-Sunnyvale-Santa Clara metro. More sellers and buyers are reaching mutual acceptance, and the vast majority of these pending listings will become closed sales. We expect active markets to continue during the summer months, particularly in light of cheaper credit. We shift our view on risks here: the main short-term risk factors in our view are geopolitical. Recent data releases and communications from the Fed suggest the likelihood of a rate hike any time soon is low.
Inventory of homes increased in April
The number of homes for sale increased in April, but inventory is still lean.
Months of inventory, a proxy for how long it would take for all existing homes on the market to be sold, is low in both the San Francisco-Oakland-Hayward Metro (1.4 months) and the San Jose-Sunnyvale-Santa Clara Metro (1.2 months). Both metros saw months of inventory fall last month. Traditionally, a balanced market is characterized by 5-6 months of inventory. While the five year average for the San Francisco and San Jose metro areas is just over one month, the supply/demand imbalance over this period is at least partially to blame for runaway prices.

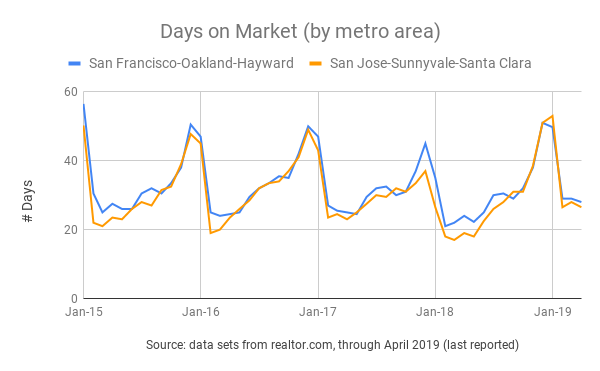
Homes are not on the market for long
The average home in both the San Francisco-Oakland-Hayward metro and the San Jose-Sunnyvale-Santa Clara metro takes just under 30 days to sell. At the moment, it is not uncommon for the most desirable properties in San Francisco/East Bay to sell in just two weeks. Nationally, the average home spends 58 days on the market.
Despite above average inventory for this time of year, the market continues to digest new supply as it comes online.
Local Economy
The Bay Area continues to experience a period of strong economic performance (though much work remains to address homelessness, growing financial disparity, and access to credit).
| Low Unemployment | Steady Job Creation | Strong Wage & Salary Growth | Inflation |
|---|---|---|---|
| 2.8% | 2.3% | 3.8% | 3.5% |
| Virtual full employment: the majority of those who are able and want to work can secure employment. | Many firms are actually challenged to find folks to hire in the current climate, according to California Dept. of Transport. | Real per capital income is expected to surpass $135k by 2023. | Above the national average, though down from the last release at 4.5%. |
| Source: BLS, DoT | Source: BLS, DoT | Source: BLS, DoT | Source: BLS |
Looking ahead…
(No major departure from our view last month.)
Home buying activity continues to increase month-on-month. The next few months are likely to see strong demand and rising prices (albeit at a moderate pace). This view is predicated on those factors covered above (lower mortgage rates and a lack of housing supply) as well as the strength of the local economy, seasonality, and the strong financial profile of local homebuyers.
A recession, a shock to the local economy, or a meaningful increase to the cost of borrowing could all negatively impact buyer demand. We see all three scenarios as unlikely in the short run.
Boomin’ local economy
The local economy is strong and continues to outperform most jurisdictions and the U.S. as a whole. Robust economic fundamentals contribute towards greater demand for homes.
High-season for home buying is underway
Early spring through autumn generally marks the high-season in residential real estate. Attractive properties that are priced appropriately are receiving multiple offers. Sellers are placing increased emphasis on the structure and negotiation of offers received. Naturally, buyers and sellers with best-in-class professional support will have an advantage.
Highly-qualified buyers
Wages and salaries in the Bay are higher than the state average - and expected to rise. By 2023, real per capita income in San Francisco County will exceed $135,000. Furthermore, homebuyers in San Francisco have amongst the strongest credit scores of any city in the nation.
Co-buying gets you more bang for your buck
Pooling resources to buy a home can be a great way to get a down payment together and to benefit from economies of scale. Every month, we illustrate the benefits of combined purchasing power with up-to-date market data.
In the example below, we assume:
- 10% down payment (not a hard requirement, many borrowers qualify with less)
- closing costs (buy-side) amount to 2.5% of the purchase price
- median list price for a 1-bed = $604k
- median list price for a 2-bed = $700k
- median list price for a 3-bed = $876k
- median list price for a 4-bed = $1,200k
Source: realtor.com data for SF-Oakland-Hayward Metro as of April 2019
Economies of Scale
| Flying solo | Teaming up to co-buy |
|---|---|
| single buyer / 1 bedroom home | 3 co-buyers / 3 bedroom home |
| A single buyer would need $76k in cash up front for down payment and closing costs. | Three co-buyers would need to each contribute $37k up front for down payment and closing costs. |
Breaking it down…
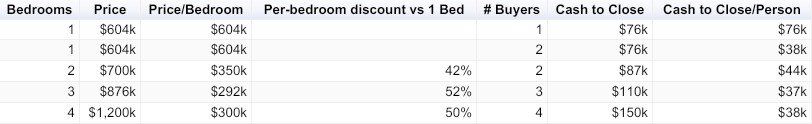
On a per-bedroom basis, purchasing a three-bedroom home in the SF-Oakland-Hayward metro is currently 52% cheaper than purchasing a one-bedroom home. Economies of scale are real! Co-buying can deliver more bang for your buck and provide greater optionality.
Related Posts
Curious about co-buying?
We're here to help, seven days a week.
